It’s a bit annoying that wherever I look for it, linear regression is always beeing formulated as the minimization function of the vertical distances sum. This covers the casuistic where data is prominently in an horizontal distribution, so it has the best chance to assure that if range is below π/4, it will get the best line that fits the data.
But, how about if data is spread in the half sector above
π/4. Then the minimization function should look for the horizontal distance.
Lets take a look for an ill conditioned dataset as the one pictured below:
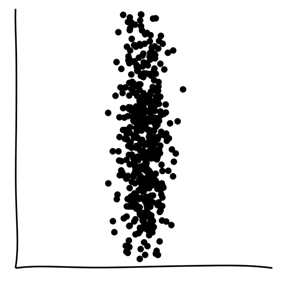
Or figure a random set of points inside a vertical oriented ellipse (there is also some code to draw the ellipse perimeter).
This kind of data set may never get a chance to be fitted if looking for vertical distance minimization.
To solve this I’ve come to this code that solves the lack of criteria. It still can not do anything against three of the
Anscombe’s quartet, but, you know, there should not be tried a linear regression against any ill conditioned data.
And finally, but not the least, some code to compute Ramer-Douglas-Peucker (RDP) approximation to a dataset, very handy to reduce the number of points. I’d already developed an algorithm, not so CPU demanding, that also achieves similar reduction, but RPD is interesting as it’s not constrained by minimal length criteria… but it takes a life to compute some big sets of data.
Option Explicit

Public Const PI As Double = 3.14159265358979
Public Const PI_RAD As Double = PI / 180
Public Const EULER As Double = 2.71828182845905
Public Const g_BASE As Long = 0

Private Type tXYZ
    X As Double
    Y As Double
    Z As Double
End Type

Public Sub sLinearRegression()
    Dim oPoint() As tXYZ
    Dim lgItem As Long
    Dim aData As Variant
    Dim dbR²ToX As Double
    Dim dbR²ToY As Double
    Dim aRegressionV() As Double
    Dim aRegressionH() As Double

    aData = Selection.Value2
    ReDim oPoint(LBound(aData, 1) To UBound(aData, 1))
    For lgItem = LBound(aData, 1) To UBound(aData, 1)
        oPoint(lgItem).X = aData(lgItem, 1)
        oPoint(lgItem).Y = aData(lgItem, 2)
    Next lgItem

    aRegressionV() = fLinearRegression(oPoint())

    Erase oPoint()
    Erase aData
End Sub

Public Function fLinearRegressionRange(ByRef rgRangeData As Excel.Range) As Variant
    Dim oPoint() As tXYZ
    Dim lgItem As Long
    Dim aData As Variant

    aData = rgRangeData.Value2
    ReDim oPoint(LBound(aData, 1) To UBound(aData, 1))
    For lgItem = LBound(aData, 1) To UBound(aData, 1)
        oPoint(lgItem).X = aData(lgItem, 1)
        oPoint(lgItem).Y = aData(lgItem, 2)
    Next lgItem

    fLinearRegressionRange = fLinearRegression(oPoint())

    Erase oPoint()
    Erase aData
End Function

Public Function fLinearRegression(ByRef oPoint() As tXYZ) As Double()
' http://mathworld.wolfram.com/CorrelationCoefficient.html
' Check the Anscombe's quartet (ill conditioned data)
    'Y = ß0 + (ß1 * X)
    Dim lgItem As Long
    Dim lgPoints As Long
    Dim Xmean As Double
    Dim Ymean As Double
    Dim SSxx As Double
    Dim SSyy As Double
    Dim SSxy As Double
    'Dim SSR As Double
    'Dim SSE As Double
    Dim aReturnV(1 To 7) As Double
    Dim aReturnH(1 To 7) As Double

    For lgItem = LBound(oPoint) To UBound(oPoint)
        Xmean = Xmean + oPoint(lgItem).X
        Ymean = Ymean + oPoint(lgItem).Y
    Next lgItem
    lgPoints = (UBound(oPoint) - LBound(oPoint) + 1)
    Xmean = Xmean / lgPoints
    Ymean = Ymean / lgPoints

    SSxx = -(Xmean * Xmean) * lgPoints
    SSyy = -(Ymean * Ymean) * lgPoints
    SSxy = -(Xmean * Ymean) * lgPoints
    For lgItem = LBound(oPoint) To UBound(oPoint)
        ' For Correlation Coefficient
        SSxx = SSxx + (oPoint(lgItem).X * oPoint(lgItem).X)
        SSyy = SSyy + (oPoint(lgItem).Y * oPoint(lgItem).Y)
        SSxy = SSxy + (oPoint(lgItem).X * oPoint(lgItem).Y)
    Next lgItem

    ' Find SSR (sum of squared residuals, the quantity to minimize) and SSE (sum of squared errors)
    aReturnV(1) = SSxy / SSxx                    ' Slope --> ß1
    aReturnV(2) = Ymean - (aReturnV(1) * Xmean)  ' Origin --> ß0
    aReturnV(3) = SSxy ^ 2 / (SSxx * SSyy)       ' Correlation Coefficient --> R²
    aReturnV(4) = Xmean
    aReturnV(5) = Ymean
    aReturnV(6) = SSyy * (1 - aReturnV(3))   ' SSR = SSyy * (1 - R²)
    aReturnV(7) = SSyy - aReturnV(6)         ' SSE = ß1 * SSxy = ß1² * SSxx = SSyy - SSR

    ' Rotate the minimizer function 90º, to check ill conditioned data
    aReturnH(1) = SSxy / SSyy                    ' Slope --> ß1'
    aReturnH(2) = Xmean - (aReturnH(1) * Ymean)  ' Origin --> ß0'

    ' Get inverse correlation:
    aReturnH(1) = 1 / aReturnH(1)                ' ß1 = 1/ß1'
    aReturnH(2) = -aReturnH(2) * aReturnH(1)     ' ß0 = -ß0'* ß1

    aReturnH(3) = SSxy ^ 2 / (SSxx * SSyy)       ' Correlation Coefficient --> R²
    aReturnH(4) = Xmean
    aReturnH(5) = Ymean
    aReturnH(6) = SSxx * (1 - aReturnH(3))   ' SSR = SSxx * (1 - R²)
    aReturnH(7) = SSxx - aReturnH(6)         ' SSE = ß1 * SSxy = ß1² * SSyy = SSxx - SSR

    If aReturnH(6) > aReturnV(6) Then
        fLinearRegression = aReturnV()
    Else
        fLinearRegression = aReturnH()
    End If

    Erase aReturnV()
    Erase aReturnH()
End Function

Public Function fEllipseXL(ByRef aSemiAxis As Double, _
                           ByRef bSemiAxis As Double, _
                           ByRef Ø As Double, _
                           ByRef Xc As Double, _
                           ByRef Yc As Double, _
                           Optional ByRef ß As Double, _
                           Optional ByRef bFull As Boolean) As Double()
    Dim oCenter As tXYZ
    Dim oPoint() As tXYZ
    Dim aData() As Double
    Dim lgPoint As Long

    With oCenter
        .X = Xc
        .Y = Yc
    End With

    'oPoint() = fEllipse(aSemiAxis, bSemiAxis, Ø, oCenter, ß, bFull)
    oPoint() = fEllipsePolar(aSemiAxis, bSemiAxis, Ø, oCenter, ß, bFull)
    ReDim aData(LBound(oPoint) To UBound(oPoint), 1 To 2)
    For lgPoint = LBound(oPoint) To UBound(oPoint)
        aData(lgPoint, 1) = oPoint(lgPoint).X
        aData(lgPoint, 2) = oPoint(lgPoint).Y
    Next lgPoint

    fEllipseXL = aData()
End Function

Public Function fEllipsePolar(ByRef aSemiAxis As Double, _
                              ByRef bSemiAxis As Double, _
                              ByRef Ø As Double, _
                              ByRef oCenter As tXYZ, _
                              Optional ByRef ß As Double = 0, _
                              Optional ByRef bFull As Boolean = False) As tXYZ()
' For polar angles from center

    Dim lgAngle As Long
    Dim lgPoint As Long
    Dim dbRadius As Double
    Dim dbAngle As Double
    Dim oPoint() As tXYZ
    Dim oPointTmp As tXYZ
    Dim dbMajorAxis As Double
    Dim eccentricity As Double

    If bFull Then
        ' Fill initial values
        lgPoint = g_BASE - 1

        ' Select case major semiaxis
        If aSemiAxis >= bSemiAxis Then
            eccentricity = VBA.Sqr((aSemiAxis * aSemiAxis) - (bSemiAxis * bSemiAxis)) / aSemiAxis

            For lgAngle = 0 To 360 Step 10
                lgPoint = lgPoint + 1
                ReDim Preserve oPoint(0 To lgPoint)
                dbAngle = VBA.CDbl(lgAngle * PI_RAD)
                dbRadius = bSemiAxis / VBA.Sqr(1 - (eccentricity * VBA.Cos(dbAngle) ^ 2))
                oPoint(lgPoint).X = dbRadius * VBA.Cos(dbAngle)
                oPoint(lgPoint).Y = dbRadius * VBA.Sin(dbAngle)
            Next lgAngle

        ElseIf aSemiAxis < bSemiAxis Then
            eccentricity = VBA.Sqr((bSemiAxis * bSemiAxis) - (aSemiAxis * aSemiAxis)) / bSemiAxis

            For lgAngle = 0 To 360 Step 10
                lgPoint = lgPoint + 1
                ReDim Preserve oPoint(0 To lgPoint)
                dbAngle = VBA.CDbl(lgAngle * PI_RAD)
                dbRadius = aSemiAxis / VBA.Sqr(1 - (eccentricity * VBA.Cos(dbAngle) ^ 2))
                oPoint(lgPoint).X = dbRadius * VBA.Cos(dbAngle)
                oPoint(lgPoint).Y = dbRadius * VBA.Sin(dbAngle)
            Next lgAngle
        End If

        For lgPoint = LBound(oPoint) To UBound(oPoint)
            ' For a rotated ellipse:
            oPointTmp.X = (oPoint(lgPoint).X * Cos(Ø)) - (oPoint(lgPoint).Y * Sin(Ø)) + oCenter.X
            oPointTmp.Y = (oPoint(lgPoint).X * Sin(Ø)) + (oPoint(lgPoint).Y * Cos(Ø)) + oCenter.Y
            oPoint(lgPoint) = oPointTmp
        Next lgPoint
    Else
        ReDim oPoint(0)
    End If

    fEllipsePolar = oPoint()

End Function

Public Function fEllipse(ByRef aSemiAxis As Double, _
                         ByRef bSemiAxis As Double, _
                         ByRef Ø As Double, _
                         ByRef oCenter As tXYZ, _
                         Optional ByRef ß As Double = 0, _
                         Optional ByRef bFull As Boolean = False) As tXYZ()
' https://en.wikipedia.org/wiki/Ellipse
' Cannonical equation A·X² + B·X·Y + C·Y² + D·X + E·Y + F = 0
' canonical implicit equation: Xcan²/a² + Ycan²/b² = 1
' Xcan = (X - oCenter.X) * Cos(Ø) + (Y - oCenter.Y) * Sin(Ø)
' Ycan = -(X - oCenter.X) * Sin(Ø) + (Y - oCenter.Y) * Cos(Ø)
' Parametric form: (x,y)=(a*cos t,b*sin t) 0 <= t < 2*pi
' A = aSemiAxis² * (Sin(Ø))² + bSemiAxis² * (Cos(Ø))²
' B = 2 * (bSemiAxis² - aSemiAxis²) * Sin(Ø) * Cos(Ø)
' C = aSemiAxis² * (Cos(Ø))² + bSemiAxis² * (Sin(Ø))²
' D = -2·A·oCenter.X - B·oCenter.Y
' E = -B·oCenter.X - 2·C·oCenter.Y
' F = A·oCenter.X² + B·oCenter.X·oCenter.Y + C·oCenter.Y² - A²·B²
' ð = ((A·C) - (B²/4))·F + (B·E·D/4) - ((C·D²)/4) - ((A·E²)/4)

    Dim ð As Double 'discriminant for non degenerated ellipse
    Dim A As Double
    Dim B As Double
    Dim C As Double
    Dim D As Double
    Dim E As Double
    Dim F As Double
    Dim lgSegment As Long
    Dim lgPoint As Long
    Dim oPoint() As tXYZ
    Dim oPointTmp As tXYZ

    A = (aSemiAxis * Sin(Ø)) ^ 2 + (bSemiAxis * Cos(Ø)) ^ 2
    B = 2 * (bSemiAxis ^ 2 - aSemiAxis ^ 2) * Sin(Ø) * Cos(Ø)
    C = (aSemiAxis * Cos(Ø)) ^ 2 + (bSemiAxis * Sin(Ø)) ^ 2
    D = -2 * A * oCenter.X - B * oCenter.Y
    E = -B * oCenter.X - 2 * C * oCenter.Y
    F = (A * oCenter.X ^ 2) + (B * oCenter.X * oCenter.Y) + (C * oCenter.Y ^ 2) - (A * B) ^ 2

    ð = ((A * C) - (B ^ 2 / 4)) * F + (B * E * D / 4) - ((C * D ^ 2) / 4) - ((A * E ^ 2) / 4)

    If ð <= 0 Then ' not degenerated ellipse
        If bFull Then
            ReDim oPoint(0 To 40)
            ' Fill initial values
            lgPoint = -1
            For lgSegment = 0 To 19
                lgPoint = lgPoint + 1
                oPoint(lgPoint).X = -aSemiAxis + (aSemiAxis * lgSegment / 10)
                oPoint(lgPoint).Y = bSemiAxis * VBA.Sqr(1 - (oPoint(lgPoint).X / aSemiAxis) ^ 2)
            Next lgSegment

            lgPoint = lgPoint + 1
            oPoint(lgPoint).X = aSemiAxis
            oPoint(lgPoint).Y = 0

            For lgSegment = 19 To 1 Step -1
                lgPoint = lgPoint + 1
                oPoint(lgPoint).X = -aSemiAxis + (aSemiAxis * lgSegment / 10)
                oPoint(lgPoint).Y = -bSemiAxis * VBA.Sqr((1 - (oPoint(lgPoint).X / aSemiAxis) ^ 2))
            Next lgSegment

            lgPoint = lgPoint + 1
            oPoint(lgPoint) = oPoint(LBound(oPoint))

            For lgPoint = 0 To 40
                'For a rotated ellipse:
                oPointTmp.X = (oPoint(lgPoint).X * Cos(Ø)) - (oPoint(lgPoint).Y * Sin(Ø)) + oCenter.X
                oPointTmp.Y = (oPoint(lgPoint).X * Sin(Ø)) + (oPoint(lgPoint).Y * Cos(Ø)) + oCenter.Y
                oPoint(lgPoint) = oPointTmp
            Next lgPoint
        Else
            ReDim oPoint(0)
        End If

        fEllipse = oPoint()

    'ElseIf ð = 0 Then 'point ellipse
    '    ReDim oPoint(0)
    '    oPoint(0) = oCenter
    '    fEllipse = oPoint()

    End If

End Function

Private Function fDistanceToLine(ByVal px As Double, ByVal py As Double, _
                                 ByVal X1 As Double, ByVal Y1 As Double, _
                                 ByVal X2 As Double, ByVal Y2 As Double, _
                                 Optional ByRef t As Double) As Double
' Calculate the distance between the point and the segment.
' http://vb-helper.com/howto_distance_point_to_line.html
' https://en.wikipedia.org/wiki/Distance_from_a_point_to_a_line
' http://mathworld.wolfram.com/Point-LineDistance2-Dimensional.html
    Dim dX As Double
    Dim dY As Double

    dX = X2 - X1
    dY = Y2 - Y1
    If (dX = 0 And dY = 0) Then
    ' It's a point not a line segment.
        dX = px - X1
        dY = py - Y1
        near_x = X1
        near_y = Y1
        fDistanceToLine = VBA.Sqr(dX * dX + dY * dY)
        Exit Function
    End If

    ' Calculate the t that minimizes the distance.
    t = ((px - X1) * dX + (py - Y1) * dY) / (dX * dX + dY * dY)

    ' See if this represents one of the segment's end points or a point in the middle.
    If t  1 Then
        dX = px - X2
        dY = py - Y2
        near_x = X2
        near_y = Y2
    Else
        near_x = X1 + t * dX
        near_y = Y1 + t * dY
        dX = px - near_x
        dY = py - near_y
    End If

    fDistanceToLine = VBA.Sqr(dX * dX + dY * dY)
End Function

Public Function fDistance2DPoints(ByRef oPointA As tXYZ, ByRef oPointB As tXYZ) As Double
    Dim dX As Double
    Dim dY As Double

    dX = oPointA.X - oPointB.X
    dY = oPointA.Y - oPointB.Y

    fDistance2DPoints = VBA.Sqr((dX * dX) + (dY * dY))
End Function

Public Sub sDouglasPeucker()
    Dim lgItem As Long
    Dim lgR As Long
    Dim lgC As Long
    Dim aData As Variant
    Dim oPoint() As tXYZ
    Dim oPtFilter() As tXYZ
    Dim Threshold As Double

    aData = Selection.Value2
    ReDim oPoint(LBound(aData, 1) To UBound(aData, 1))
    For lgItem = LBound(aData, 1) To UBound(aData, 1)
        oPoint(lgItem).X = aData(lgItem, 1)
        oPoint(lgItem).Y = aData(lgItem, 2)
    Next lgItem

    Threshold = VBA.Val(VBA.InputBox("Threshold value", , 1))
    oPtFilter() = fDouglasPeucker(oPoint(), Threshold)

    'Show in Worksheet:
    With ActiveSheet
        lgR = Selection.Row - 1
        lgC = Selection.Column
        For lgItem = LBound(oPtFilter) To UBound(oPtFilter)
            lgR = lgR + 1
            .Cells(lgR, lgC + 2).Value2 = oPtFilter(lgItem).X
            .Cells(lgR, lgC + 3).Value2 = oPtFilter(lgItem).Y
        Next lgItem
    End With

    Erase oPoint()
    Erase aData
End Sub

Public Function fDouglasPeucker(ByRef oPoint() As tXYZ, _
                                Optional ByVal Threshold As Double = 0) As tXYZ()
' https://en.wikipedia.org/wiki/Ramer%E2%80%93Douglas%E2%80%93Peucker_algorithm
' Ramer–Douglas–Peucker algorithm (RDP)
' ToDo: Solve "crossing" segments (one/several vertex get trapped)...
' ToDo: if no more than one vertex get inside a segment, then if that vertex below threshold, can be deleted

    Dim oLine() As tXYZ
    Dim lgPoint As Long
    Dim lgSegment As Long
    Dim lgItem As Long
    Dim lgMove As Long
    Dim dbDistance As Double
    Dim dbDistanceMax As Double
    Dim dbCheck As Double
    Dim lgBreaker As Long
    Dim bClosest As Boolean
    Dim dbVectorMultiplier As Double
    Dim bBreaker As Boolean
    Dim bIterate As Boolean

    If Not (Not oPoint()) Then
        If Threshold = 0 Then
            fDouglasPeucker = oPoint()
            Exit Function
        End If

        ' Get K.P. for each point
        oPoint(LBound(oPoint)).Z = 0
        For lgPoint = (LBound(oPoint) + 1) To UBound(oPoint)
            oPoint(lgPoint).Z = oPoint(lgPoint - 1).Z + fDistance2DPoints(oPoint(lgPoint), oPoint(lgPoint - 1))
        Next lgPoint

        lgSegment = g_BASE + 1
        ReDim Preserve oLine(g_BASE + 0 To lgSegment)
        oLine(g_BASE + 0) = oPoint(LBound(oPoint))
        oLine(g_BASE + 1) = oPoint(UBound(oPoint))

        Do
            bIterate = False

            lgPoint = LBound(oPoint) ' initialze with first item
            For lgSegment = LBound(oLine) To UBound(oLine) - 1
                dbDistanceMax = Threshold
                bBreaker = False

                For lgPoint = (LBound(oPoint) + 1) To (UBound(oPoint) - 1) 'Avoid extremes, as they are already in the final set
                    dbDistance = fDistanceToLine(oPoint(lgPoint).X, oPoint(lgPoint).Y, _
                                                 oLine(lgSegment).X, oLine(lgSegment).Y, _
                                                 oLine(lgSegment + 1).X, oLine(lgSegment + 1).Y, _
                                                 dbVectorMultiplier)
                    ' First condition to apply only if is inside range: oLine(lgSegment).KP <= oNearestOnLine.KP = 0 And dbVectorMultiplier <= 1) Then
                        ' Second condition is to apply only if point is the closest to any other segment...
                        bClosest = True ' Initialize
                        For lgItem = LBound(oLine) To (UBound(oLine) - 1)
                            If lgItem  lgSegment Then ' avoid itself...
                            dbCheck = fDistanceToLine(oPoint(lgPoint).X, oPoint(lgPoint).Y, _
                                                      oLine(lgItem).X, oLine(lgItem).Y, _
                                                      oLine(lgItem + 1).X, oLine(lgItem + 1).Y, _
                                                      dbVectorMultiplier)
                                If (dbVectorMultiplier >= 0 And dbVectorMultiplier <= 1) Then ' Only if inside range...
                                    If dbCheck < dbDistance Then
                                        bClosest = False
                                        Exit For
                                    End If
                                End If
                            End If
                        Next lgItem

                        If bClosest Then
                            If dbDistanceMax  UBound(oPoint) Then Exit For ' only if points sorted...
            Next lgSegment
        Loop While bIterate

        fDouglasPeucker = oLine()
    End If
End Function

Public Function fDouglasPeuckerRange(ByRef rgRangeData As Excel.Range, _
                                     Optional ByVal Threshold As Double = 0) As Variant
    Dim lgItem As Long
    Dim aData As Variant
    Dim oPoint() As tXYZ
    Dim oPtFilter() As tXYZ

    aData = Selection.Value2
    ReDim Preserve oPoint(LBound(aData, 1) To UBound(aData, 1))
    For lgItem = LBound(aData, 1) To UBound(aData, 1)
        oPoint(lgItem).X = aData(lgItem, 1)
        oPoint(lgItem).Y = aData(lgItem, 2)
    Next lgItem

    Threshold = 1
    oPtFilter() = fDouglasPeucker(oPoint(), Threshold)
    ReDim aData(LBound(oPtFilter) To UBound(oPtFilter), 1 To 2)
    For lgItem = LBound(oPtFilter) To UBound(oPtFilter)
        aData(lgItem, 1) = oPtFilter(lgItem).X
        aData(lgItem, 2) = oPtFilter(lgItem).Y
    Next lgItem
    fDouglasPeuckerRange = aData

    Erase oPoint()
    Erase aData
End Function
[/sourcecode]